Featured Post

The Chart

  My experience as a student in 9 th grade Spanish 1 informed how I would teach 9 th grade English over a decade later.

April 19, 2024

Stanley Cup Playoff Pool - Landing Page

The Stanley Cup Playoffs are here! 

Bookmark this post: I'll update standings and stats and things here throughout the tournament.

Stats through Game 3 of the Cup Final                                (through games played June 13)


West

East

Most goals scored (Team)

Edmonton = 67

Dallas = 52

Colorado = 43

Florida = 66

NY Rangers = 47

Carolina = 38


Lowest Team GAA

Nashville = 2.17

Vegas = 2.29

Dallas = 2.56

Edmonton = 2.76

Vancouver = 2.77


Florida = 2.15

Boston = 2.38

Toronto = 2.57

NY Rangers = 2.64


Player w/ most points

(Individual stats for scoring and goalies are below)

Edmonton = 34

Dallas = 16

Colorado = 15

Florida = 21

NY Rangers = 20

Carolina = 12

Goalie w/ best save percentage

(minimum 8 games or 500 minutes)

Dallas = .915

Vancouver = .898

Colorado = .897

Edmonton = .893

Boston = .933

NY Rangers = .927

Florida = .916


LIVE POOL STANDINGS

Rhee: 16 pts on current grid (Cup Champ = EDM) = 27 total

Paul: 16 pts on current grid  (Cup Champ = DAL) = 25 total

Marc: 16 pts on current grid (Cup Champ = FLA) = 20 total

Ben: 8 pts on current grid = 12 total

Rob: no current grid = 7 total


BONUS POOL TO MAKE UP POINTS

I personally can't stand the thought of players being totally out of the running as the playoffs near their end. This is the main reason I do not like standard bracket-style pools. So I'm offering this additional play for the folks under 20 points:

Take each of the four teams remaining, and before their Game 5 starts, you can "draft" one of these sets of players:

The team's top four scoring forwards based on points
All the other forwards on the teams
The defense
The goalies

Draft a different set of players for each team. 

In all of the remaining games, including the Stanley Cup Final, one point will be awarded to the team and player group that does each of the following:
i. Scores the first goal.
ii. Scores the game-winning goal.
iii. Contains the individual leader in shots blocked.
iv.     The winning goalie will also earn a point per game for their team.

Goals scored in overtime will earn an additional point.
Shutouts will earn a bonus point for both the goalies and the defense.
+3 points if the Conn Smythe winner is from your selected group.

TOP FOUR SCORING FORWARDS for each team (with number of game-winning goals scored):

DAL

Robertson  16 pts  (2)

Johnston 15  (2)

Benn 15

Seguin 12  (2)

FLA

Tkachuk 19 pts  (2)

Verhaeghe 17   (2)

Barkov 17    (3)

Reinhart 12    (1)

EDM

McDavid 28 pts  (1)

Draisaitl 26 pts  (2)

Nugent-Hopkins 18  (1)

Hyman 17   (2)

NYR

Trocheck 19 pts  (1)

Panarin 14   (4)

Zibanejad 14

Lafreniere 13


TOP SHOT BLOCKERS for each team (with position - D or F):

DAL

Tanev, 68 (D)

Harley, 44 (D)

Heiskanen, 40 (D)

Lindell, 40 (D)

FLA

Montour, 25 (D)

Forsling, 23 (D)

Mikkola, 22 (D)

Reinhart (F) & Ekblad (D), 21

EDM

Desharnais, 38 (D)

Nurse, 37 (D)

Kulak, 30 (D)

Bouchard, 26 (D)

NYR

Trouba 67 (D)

Fox, 37 (D)

Schneider, 31 (D)

Goodrow, 26 (F)


Round 2 - final results

Highlights:    League Leader            Next in West                 Next in East        Eliminated


Winning Picks in the grid + who has them.


STANDINGS

Rob: 0 pts this rd = 7 total

Rhee: 5 pts this rd = 11 total

Paul: 6 pts this rd = 9 total

Ben: 2 pts this rd = 4 total

Marc: 2 pts this rd = 4 total


Final Grid - covering the Conference and Stanley Cup Final:
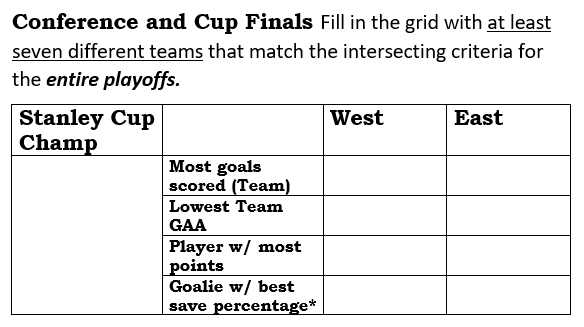


GAA = Goals-Against Average.  The average number of goals that a team has allowed per game. 

* Goalie must have a minimum of 8 games or 500 minutes played.

SCORING:  5 points for the correct Cup Champion; 2 points for all other squares.

You may place your Stanley Cup champion in up to two boxes in their conference column. If the champion leads any of the statistical categories by the end of the playoffs, the next best team in that conference will also earn pool points.

EXAMPLE: If the Rangers win the Cup and lead the league in goals scored, with Carolina and Dallas as the next-highest teams, the scoring would work like this.

Prizes awarded to the top scorer on this grid alone AND the pool points leader overall.


NOTE:  If you find that the current leader in a category or conference is an eliminated team, you can put that team in your grid if you don't think any team that's still playing will surpass them in that category.


Overall Playoff Leaders through two rounds.

In several cases, the league-leading team has been eliminated. So you'll need to predict which team, if any, can surpass them by the end of the Cup Final. 


West

East

Most goals scored (Team)

Edmonton = 46

Colorado = 43

Dallas = 38

Vancouver = 33


Florida = 39

Carolina = 38

NY Rangers = 35

Lowest Team GAA

Nashville = 2.17

Vegas = 2.29

Dallas = 2.38

Edmonton = 2.75

Boston = 2.38

Florida = 2.45

Toronto = 2.57

NY Rangers = 2.60

Player w/ most points

 (Individual stats for scoring and goalies are below)

Edmonton = 23

Colorado = 15

Dallas = 13

Vancouver = 12


Florida = 14

NY Rangers = 14


Goalie w/ best save percentage

(minimum 8 games or 500 minutes)

Dallas = .918

Vancouver = .898

Colorado = .897

Edmonton = .881

Boston = .933

NY Rangers = .923

Florida = .902


Individual Scorers (through Round 2)

GP = Games Played G=Goals  A=Assists  P=Points  EVP=Points at Even-Strength

Player

Team

GP

G

A

P

EVP

Shots

Leon Draisaitl

EDM

12

8

16

24

12

45

Connor McDavid

EDM

12

2

19

21

10

32

Evan Bouchard

EDM

11

5

15

20

12

40

Ryan Nugent-Hopkins

EDM

12

4

12

16

9

17

Cale Makar

COL

11

5

10

15

7

36

Vincent Trocheck

NYR

10

6

8

14

5

30

Nathan MacKinnon

COL

11

4

10

14

7

46

Matthew Tkachuk

FLA

11

4

10

14

10

44

Mikko Rantanen

COL

11

4

10

14

9

32

Mika Zibanejad

NYR

10

3

10

14

5

24

Zach Hyman

EDM

12

11

2

13

9

50

Miro Heiskanen

DAL

13

5

8

13

6

34

Aleksander Barkov

FLA

11

5

8

13

7

27

Brock Boeser

VAN

12

7

5

12

10

27

Jason Robertson

DAL

13

3

9

12

6

26

J.T. Miller

VAN

13

3

9

12

8

29

Wyatt Johnston

DAL

12

7

4

11

7

42

Valeri Nichushkin

COL

8

9

1

10

5

24

Chris Kreider

NYR

10

7

3

10

4

29

Carter Verhaeghe

FLA

10

6

4

10

8

39

Sebastian Aho

CAR

10

3

7

10

10

28

Sam Reinhart

FLA

10

5

4

9

6

46


Goalies – minimum 8 games or 500 min. played

GP = Games Played  SA = Shots Against  SVS = Saves   SP = Save Percentage  GAA = Goals-Against Average Min = Minutes Played

Player

Team

GP

SA

SVS

SP

GAA

Min

Igor Shesterkin

NYR

10

324

299

.923

2.40

626

Sergei Bobrovsky

FLA

11

264

238

.902

2.37

657

Jake Oettinger

DAL

13

355

326

.918

2.09

832

Jeremy Swayman

BOS

12

373

348

.933

2.15

697

Frederik Andersen

CAR

10

267

239

.895

2.62

642

Alexander Georgiev

COL

11

311

279

.897

2.85

694

Stuart Skinner

EDM

10

235

201

.881

2.87

585

Arturs Silovs

VAN

10

283

254

.898

2.91

598


Sample grids. The grids show you results from Round 1.

TIES/REPEATS
EAST Most penalty min: Carolina, then Washington
Carolina – first in Penalties Drawn and Net Penalties
WEST Net penalties: Edmonton, then Dallas


TIES/REPEATS & Notes
Fewest goals allowed: Boston, then Carolina.
WEST Fewest shots against: Vancouver, then Dallas. 
EAST Fewest shots against: NYR, then Washington. 


Round 1 so far (one more game to go)

Writing this the morning of Sunday, May 5. Will keep updating periodically.


First Round Pool Standings:

NOTE: Vegas or Dallas can also earn a point in the middle, "Longest Series in the West" square.


Rob: 7 points     

Rhee: 6 points

Paul (me): 3 points

Marc: 2 points

Ben: 2 points


Join the Pool for the Second Round!

The form will be available shortly, along with some new preview sample grids to help with your picks. Here is the grid you will complete:


Forms will be accepted at any time before the first game of the second round begins.

Post your grid in the comments or send via What'sApp or email it to me: coach.pinza@gmail.com  

Entry fee: $20 - do the Venmo    [ You do NOT have to pay more than once for the entire playoffs. First round players do NOT pay for future rounds. ]

($10 will go to prize money, the rest to scholarships for students at Chabot College who are transferring to university.  You're welcome to increase your donation by simply increasing the payment.)  

Full, detailed rules and sample grids available through my three preview blogs:  123.

Good luck everyone!

Mr. P

April 18, 2024

To Finity. Then Beyond.

Here is a journal entry from the end of March. It's a time when most educators are really feeling the strain of the season. Spring Break may be a week or two away, and many of us are pushing back against fatigue in order to grind our way through. Perhaps other industries feel this way, too. The stretch between President's Weekend and Memorial Day is really long, and I've always felt like we need a break about every six weeks. So I'm always mindful of when things like social events or happy hours occur. I also try to moderate staff meeting content during these harder parts of the year - keeping agendas light, mixing in short bits of entertainment, and minimizing the number of meetings whenever I can in this stretch.

So on this morning - March 29, one of several cloudy and rainy days in the early Spring - I was synthesizing lots of different lessons and reflections across this six-week slog:

To Finity. Then Beyond.

Time and energy are finite, so the goals we set need to honor those limits. We must ensure that our most deeply held values inform our prioritization, then we need to acknowledge how far we can go within the time, energy, and resource constraints we have. Short-term benchmarks can maintain, not just practical progress, but emotional investment if you celebrate a variety of milestones - especially smaller ones that are not openly visible to those outside the working team. 

But if you are like me, and you don't have an eagle eye that can accurately measure or predict how long certain tasks might take, scheduling these benchmarks can be a tough puzzle. This is especially true if you are working on something innovative; there may be little or no prior experience to draw on. So let's openly acknowledge another finite resource: our fortune-telling capabilities. 

Stick to a Schedule Without Getting Sticky

The project timeline is always a guess, but it's still a vital tool that anchors and guides everyone's efforts. Here are some hacks I am trying to be a better long-range planner:

1) Check your current calendar. Objectively, a project may take ten person-hours in terms of pure labor, but when can you dedicate those hours? How long will it take to "bank" that time? If you looked at your current calendar for the next two weeks, how many hours are currently unaccounted for? How much further into your calendar would you need to look in order to carve out the full set of ten? 

2) Stay flexible. As you just experienced in that little exercise, managers will need to be creative in how they clear time and space for these priorities. (Remember, I'm talking about projects that deserve your focus and energy because they are closely aligned to your and your group's deeply held values.) Agree to let some other tasks go -- or at least allow a later completion. Reciprocally, look for opportunities to marshall additional resources to help the team move more quickly or help them to clear their plates in order to focus on this project. (Chances are, their calendars are looking just as packed as yours.)

3) Build time into the timeline. This can look like check-in times at key points that can become natural  breaks -- remember my six-week cycle from earlier. In fact, we should never stigmatize rest. Consider that this 'extra' time could be for team fun: happy hour, bowling night. I don't think this is an 'extra' at all; it's a crucial release valve for the stress of a very important project. It's also a simple way to prioritize the mental and emotional health and fitness of your people, which should be at the core of how we lead. 

I firmly believe that the social and emotional life and health of an organization is crucial to its long-term success. As a leader, personally, I prioritize this beyond the standard relationship-building that many management advisors emphasize. I'm talking more about maintaining relationship and connection by making sure that the folks I lead can stay mentally and emotionally fit as they navigate this project alongside the myriad other stressors in their lives. 

Play Stops and Rest Stops

Humor and play are both integral parts of my daily management. It's a key way that I try to elevate humanity in the work environment. Building rest stops and play stops into a long-term project timeline can help everyone persist through the arduous journey. It also communicates, right from the start, that you will care for them during the hard parts. Like the dog days of Spring when the next holiday is still a couple weeks away.

At least we can look forward to Team Karaoke next week.

April 12, 2024

Pinza Playoff Pool Preview #3 - How Many Games?

Hi friends. This is the final preview for the Round 1 grid of the Stanley Cup Playoff Pool. 

If you're joining me for the first time in this space, welcome! I've recently come back to this little blog and re-discovered a real joy for writing. To stay in the habit, I'm focusing on one of my hobbies (two, actually), and launching a new pool for the Stanley Cup playoffs. Proceeds will go toward scholarships for students at Chabot College (where I work) who are transferring to university. To learn more about the pool, start with this entry

And if you know about the pool and are ready to start, do the Venmo ($20 plus whatever else you'd like to donate toward scholarships), download the form, and post your grid in the comments or send via What'sApp or email it to me: coach.pinza@gmail.com  

All right, now the hockey talk:

Playoff Series Matchups

In order to predict which of the eight first-round playoff series will be the longest, we should probably check in on the standings and see who's set to play whom. (Again, for those new to hockey/the NHL, every single playoff round is a best-of-seven series of games. First team to four wins moves on.)

There continues to be quite a bit of movement, even as we are approaching the final three or four games of the season, which ends April 18. (Playoffs begin on April 20.) So everything that follows is a snapshot through games played on April 11.

WESTERN CONFERENCE

In the Central Division, Dallas is one win away from clinching the division, which would also lock in a Colorado-Winnipeg series. Both of these teams have the exact same record right now, but Winnipeg has the first tie-breaker -- more wins without overtime. (aka "Regulation Wins" - more on overtime coming later)

For the Pacific Division, Vancouver and Edmonton are in a tight race for division, and they play each other tomorrow, April 13. Vancouver does have the lead in the standings right now; whoever wins the division most likely plays Nashville.

A bit further back, Vegas and Los Angeles are jostling to match up with either Dallas or the 2nd place Pacific team.

EASTERN CONFERENCE

Boston, Florida, and Toronto are all vying for the top spot in the Atlantic division. The two runners-up will play each other; Tampa Bay will probably play the winner. Boston currently leads the race; Toronto is a bit of a long-shot to end up on top.

Finally, in the Metropolitan division, the New York Rangers are sitting on top with Carolina still close enough to maybe overtake them in the final week of the season.

What follows is a five team race to decide who plays each of them:

The NY Islanders are currently in the lead among the five; they would face the runner-up in the division (currently Carolina).

Pittsburgh is about a game-and-a-half behind the Islanders; they would face the division champion (Rangers as of now).

Detroit, Washington, and Philadelphia are all a 1/2 game behind Pittsburgh. On tie-breakers, Detroit sits behind the other two, who play each other next Tuesday. Pittsburgh also plays the Islanders on Wednesday.

So right this second, your playoff series are these (team on the left has home ice and would host the first two games plus Games 5 and 7, if needed):


Sample Grids for the Pool: Who Plays (and Wins) in Overtime?


Detroit and the Islanders are tied for the most overtime goals scored this season with nine apiece.

The Islanders are also second in the league for most overtime games played, but here again, you need nine different teams in your first-round grid, so the next team best team (Toronto) moves into that corner square.

Since the trade deadline on March 8....


There are many ties to note here:

Most goals scored: Vegas and Colorado both have 3.

Fewest goals allowed: Four teams in the East have not allowed any; Boston and Toronto could have been listed in that row. Colorado and Los Angeles are the only Western teams with zero goals allowed.

Most games played: Pittsburgh's overtime win last night put them into a tie with Edmonton (five games apiece). Nashville is part of a crowd of teams with four games each; Colorado and Vegas are part of that group.

A final note: overtime rules are different in the regular season and the playoffs.

In the regular season (which is how the grids above are calculated), teams only play five minutes of overtime. If neither team scores, they go to a shootout.

In the Stanley Cup Playoffs, there are no shootouts. Teams play full, twenty-minute periods of overtime - whoever scores a goal in overtime wins. Overtime periods are added until someone wins, no matter how long it takes. The longest two playoff games in NHL history, both in the 1930's, had six overtime periods - the equivalent of almost three full games! 

This is a key point for the playoff pool: "longest series" will be judged by the number of game minutes total in the series. Thus, if a series includes six games, but one of those games had four overtime periods, that would potentially be a longer series than another matchup that had seven games but no overtime periods. 

6 games x 3 periods = 18, plus 4 overtime periods = 22 periods. 

7 games x 3 periods = 21 period.

However, this also depends on when the goals were scored in the overtime periods. We'll be calculating down to the minute, so the scenario gets trickier when you factor in whether the teams played all of each overtime period.

So think about the matchups, and consider which two teams you think will need the extra time to decide a winner. 

Good luck!